Some ideas are so powerful and useful that once you understand them deeply, you start to see them everywhere. One of those ideas is the normal distribution.
Normal distributions, also known as bell curves or Gaussian functions look like this:

They have a fat lump in the middle and two “tails” that stretch off in either direction, getting smaller and smaller.
That these tails get smaller and smaller, however, is an understatement. Written out as a function, a normal curve trails off according to a decaying exponential, squared. If you recall the article on growth curves, this says that the tails get smaller not only by a little bit, but they get smaller even faster than exponential decay!
Why Do Normal Distributions Matter?
Normal distributions show up everywhere. Human height is (approximately) normal. Intelligence, as measured by IQ, is normal. Measurement errors tend to be normally distributed.
The question is why does this mathematical pattern show up so much.
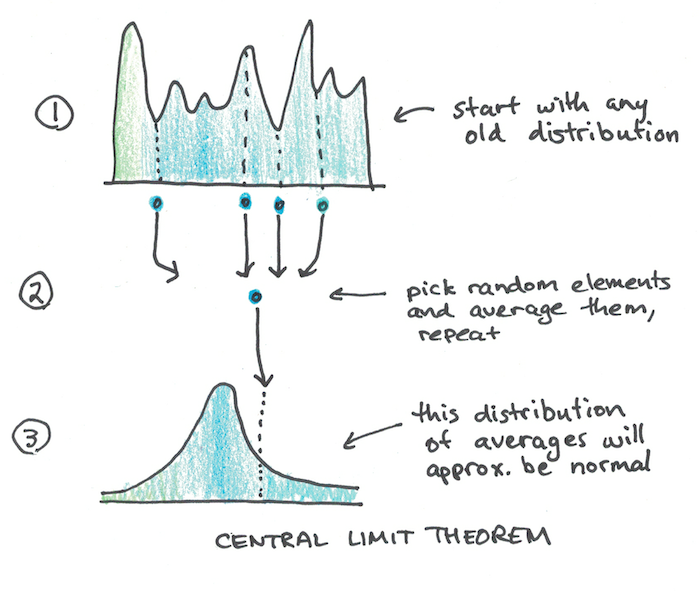
The answer is that normal distributions come out of a process of averaging. A neat little idea from statistics known as the central limit theorem says that if you take any distribution you like (it doesn’t have to be normal) and pick groups of random elements from that distribution and then take their average and, voila, you get a normal distribution.

This is why normal distributions come up so often, not because there’s some mathematical conspiracy to make things follow a bell curve, but because this is the natural pattern that results whenever you are considering a process of averaging out many small effects.
Height is likely a good example of a normal distribution because it is caused by many different genes and environmental influences, each which have small effects on height that point in different directions. Add them all together and average them and you end up with something that looks normal.
Intelligence, being similarly highly polygenic, is also something distributed normally because little influences average out and so to be really smart usually requires having been lucky enough to get a ton of random elements all pointing in the same direction.
Fat Tails, Violations of Normality and Taleb
This understanding of normal distributions, as being a process of “averaging” out many small effects from any random distribution you like, wasn’t my first exposure to the idea of normal distributions.
In fact, my first exposure to the idea came from Nassim Nicholas Taleb (NNT) in his book, The Black Swan. NNT is somewhat famous for his heated polemics against popular academic ideas, and chief among them was his charge that scientists overuse normal distributions.
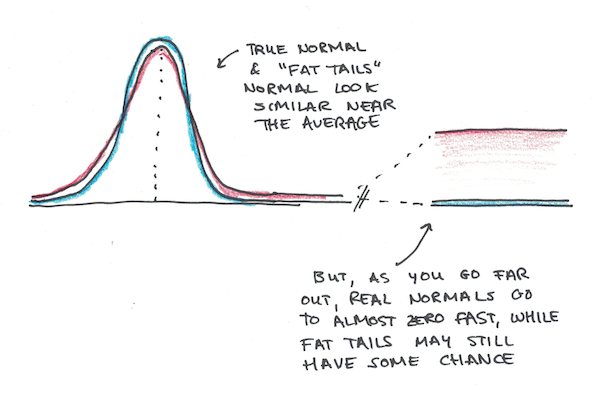
In particular, he argued, we often have distributions which have “fat tails” as he calls them. Remember the original normal distribution? It goes down even faster than exponential decay, so the tails are, mathematically speaking, quite slim. In real life, NNT argues, we tend to see events that are in the extreme tail ends more often than we would by normal distributions, and so this gives us too much confidence that rare “black swan” events are statistically impossible.
While I think there’s merit to NNT’s critique, I wish I had actually taken a statistics class before reading his book. He makes it sound as if there was no good reason for thinking in terms of normal distributions at all, and that it was just a convenient choice to make the math easier. While that can (sometimes) be true, the central limit theorem provides a convincing rationale for why approximately normal distributions are quite common.

Why the fat tails then?
Well the problem may have to do with the fact that many phenomena look like averaging most of the time, but can be swamped by one extreme effect. The genetic influence on intelligence may look like a bunch of small effects adding, except if you get an extra chromosome (a single change) you will have Downs Syndrome, which causes marked declines in cognitive ability. Similarly dwarfism or gigantism for height may be caused by a few rare mutations, rather than numerous genetic influences all pointing in the same direction by chance.
In other cases, averaging might not be the right way to think about a phenomenon at all. In financial markets, normal distributions may not adequately explain behavior because price movements aren’t caused by random, independent choices. If a dip starts to occur, others will change their behavior to compensate, either causing a rebound or a crash, and thus the conditions of normality may be violated.
How to Apply Normal Distributions
The first way to apply normal distributions is to ask yourself if the phenomenon your trying to understand can be seen as the “averaging” of a bunch of different, small, independent forces. If it is, a normal distribution may be a good approximation.
If the process is mostly averaging, but there are rare effects that aren’t averaging, you may get fat tails, where extreme outcomes happen more often than you’d predict by the normal distribution’s famously quickly declining tails.
If the process isn’t averaging out independent random actions at all, like stock market votes, you may not get something like a normal distribution at all, and thus you’re in a domain where prediction gets harder.
The value of a normal distribution is that it can give you a very good idea of what to expect when it applies. Even if you’re in a “fat tail” domain, you can still expect that the normal distribution will be a good approximation most of the time, as long as you’re not relying on it too precisely for more extreme events.

 I'm a Wall Street Journal bestselling author, podcast host, computer programmer and an avid reader. Since 2006, I've published weekly essays on this website to help people like you learn and think better. My work has been featured in The New York Times, BBC, TEDx, Pocket, Business Insider and more. I don't promise I have all the answers, just a place to start.