This is a free chapter from my new e-book, Learn More, Study Less. You can download a free preview of the e-book, or buy your copy. This chapter is on Diagraming, one of the three core holistic learning methods. This is one of eleven chapters from Part II of the book, which focuses on techniques to improve how you learn.
The final technique I have for exploring ideas is diagraming. Diagraming is a simpler form of visceralization. Creating diagrams takes more time than visualizing an image, but it is easier to do and can be used on fairly abstract ideas that would be hard to imagine otherwise. Diagraming can also be combined easily with flow-based notetaking and active reading while you are learning.
A diagram is a picture that compresses several ideas together in an easy source. The most common types of diagrams are charts. A scatterplot can compress hundreds of individual data points into a single graph. Flow-based diagrams can chart a complex series of interactions and steps onto one image that is easy to see.
Often books will come with premade diagrams to simplify the information they contain. Where they lack diagrams, constructing your own can be useful to chart the flow of ideas, picture different concepts or link different concepts together.
There are three main types of diagrams I’ll cover here: flow, concept and image diagrams. Using some combination of these three types can help you understand almost any concept. The only disadvantage of diagraming is that it takes longer than metaphor or visceralization. However, with practice I’ve been able to speed up this process as well, so that I can quickly create a crude diagram in less than a minute.
Flow-Based Diagrams
A flow based diagram is useful for:
- Charting a sequence of steps. (How to do long division, the process of creating a cash-flow statement, etc.)
- Charting historical events, creating branches linking events together not only through causation but through the time period they rest.
- Mapping out a system. (e.g. How a function works in a computer program)
The basis of a flow-based diagram is that you start with a single element, and draw connecting arrows to different ideas as they relate to that element. I could have created a diagram for the steps I undertook to write this book. Starting with the initial idea, I could have drawn lines showing subsequent steps, branching off where there is more options.
The importance in a diagram must be for your understanding, not creating a pretty picture. It is easy to get caught up in making a tidy and beautiful picture and waste hours on a diagram which could have been built in just a few minutes. Simplify and be messy if you need to.
Concept-Based Diagrams
A concept based diagram links together ideas and is closely related to flow-based notetaking. Here the associations aren’t necessarily different steps in a sequence or an order of dates, but relationships between ideas. Create arrows connecting different ideas, but include 1-3 word snippets on each arrow to note how the two ideas are related.
If I wanted to create a diagram of different financial accounting principles, I might start by writing down the four different statements: balance sheet, income, retained earnings and cash flow. From that I could then connect ideas together to form a web of information.
If I wanted to map out the characters in a novel, I could start with the protagonist in the center and map out different characters and relationships that character had. Mapping of this kind can help organize your thinking on a large quantity of information.
Start with the most important ideas and branch off into details and minor ideas.
Image Diagrams
Not technically a diagram, but image diagrams are important for diagraming so I’ll include these here. An image diagram is any rough sketch or doodle used to represent an idea or the association of ideas. Here you can create a small image either by itself or within larger diagrams to make them more memorable.
I frequently make small images in my notes or diagrams as a reference for important ideas and to make them more clear inside my head. Drawing detailed images can be a waste of time if it takes too long, but a simple 10-20 second doodle can be valuable if it helps connect the ideas properly.
Combining Diagraming with Metaphor and Visceralization
Diagrams can be mixed with the usage of metaphor and visceralization to improve your understanding of ideas. After you have found a metaphor or mental image to describe an idea, create a quick sketch, connecting different concepts together on paper.
With our calculus example from the previous section on metaphors, I could have drawn an image of a racecar and linked the odometer to a position graph and the speedometer to a speed graph. I could have associated the two of those graphs with a symbol for differentiation making the relationship between all elements clear.
Adding a diagram to a metaphor or visceralized image may be overkill for many situations, but it can be helpful for remembering a tricky idea.
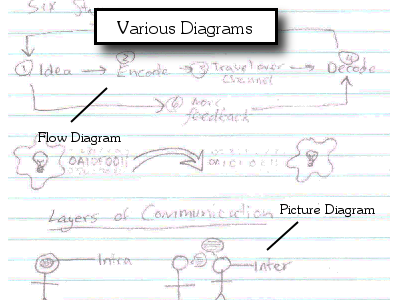
Here is an example of some diagrams I’ve scanned from my own notes:

The full version includes more visual examples of diagraming, along with featuring other techniques such as metaphor, visceralization, flow-based notetaking, information compression, pegging, linking and speed reading. Get your copy along with 6 bonus documents for 39.95.


 I'm a Wall Street Journal bestselling author, podcast host, computer programmer and an avid reader. Since 2006, I've published weekly essays on this website to help people like you learn and think better. My work has been featured in The New York Times, BBC, TEDx, Pocket, Business Insider and more. I don't promise I have all the answers, just a place to start.